
Follow a position through 36 trades
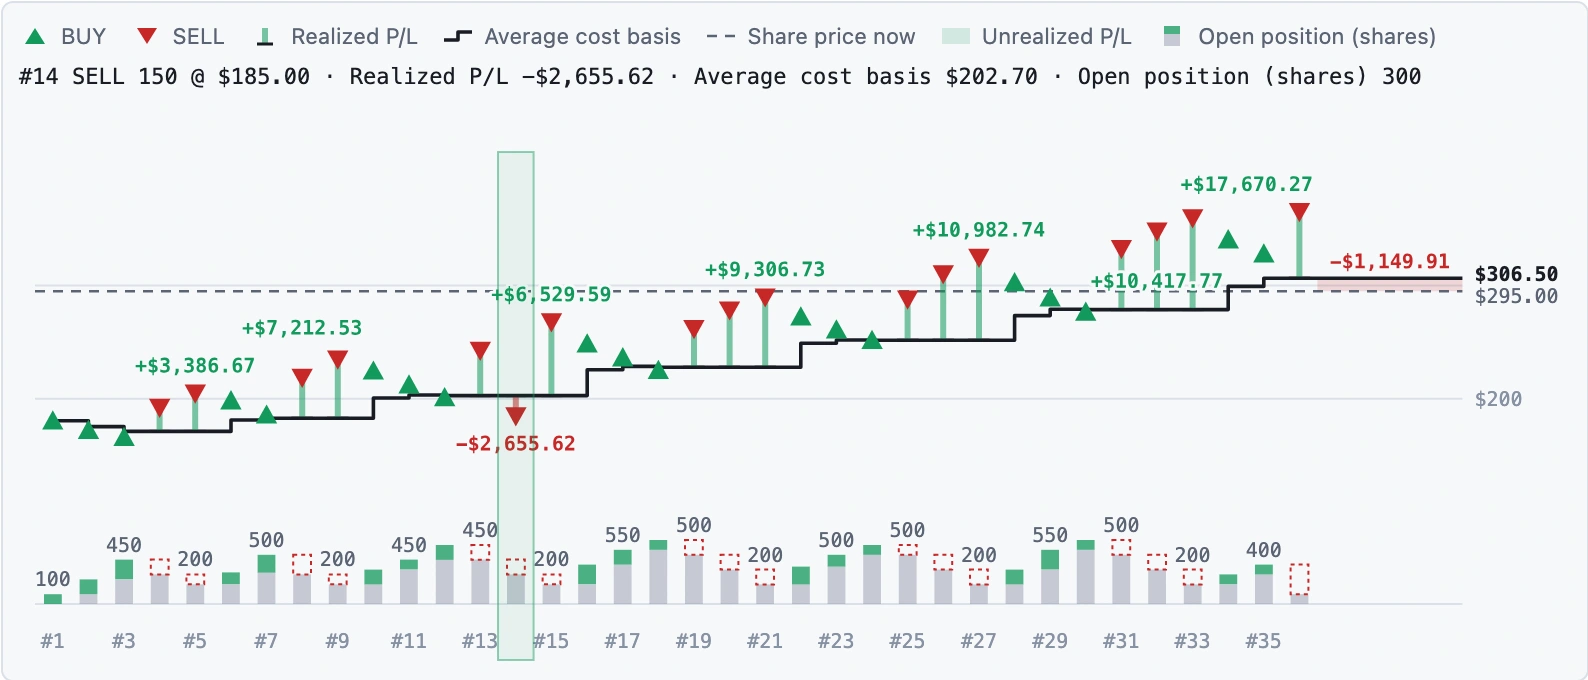
In one simulated stock position, the 14th trade lost $2,655.62. The 36 trades together made $121,550.00 at the example’s reference price of $295. Stock Calculator 2.8 lets you see where both numbers came from and change the trades yourself. Open the 36-trade example.
Read a trade, then read the whole position
The step line tracks the average cost of the shares you still hold. At each sale, a bar shows the gain or loss realized on that sale. The lower bars show how many shares were left. In the 36-trade example, moving over trade 14 shows a sale at $185.00 against an average cost of $202.70. The sale contributes to the $122,699.91 realized gain across the whole ledger. At $295, the final 100 shares contribute an unrealized loss of $1,149.91.
Choose Show trade chart under your ledger. Tap or drag across the chart on a phone, or use a pointer or the arrow keys on a computer. If you edit the trades, fees, or Share price now, your totals recalculate and the drawing waits for Update chart. You can paste up to 50 trades in Bulk edit. The homepage starts with eight trades if you want a shorter run. Try the calculator.
Explore 34 scenarios across seven categories
The gallery spans semiconductor and AI cycles, crypto, market shocks, historical records, and examples of how the calculations work. Each card shows the result. Open it to see the story and trades, then choose Open in calculator to edit the ledger. Full trade lists and charts load when you request them. Browse Worked Examples.
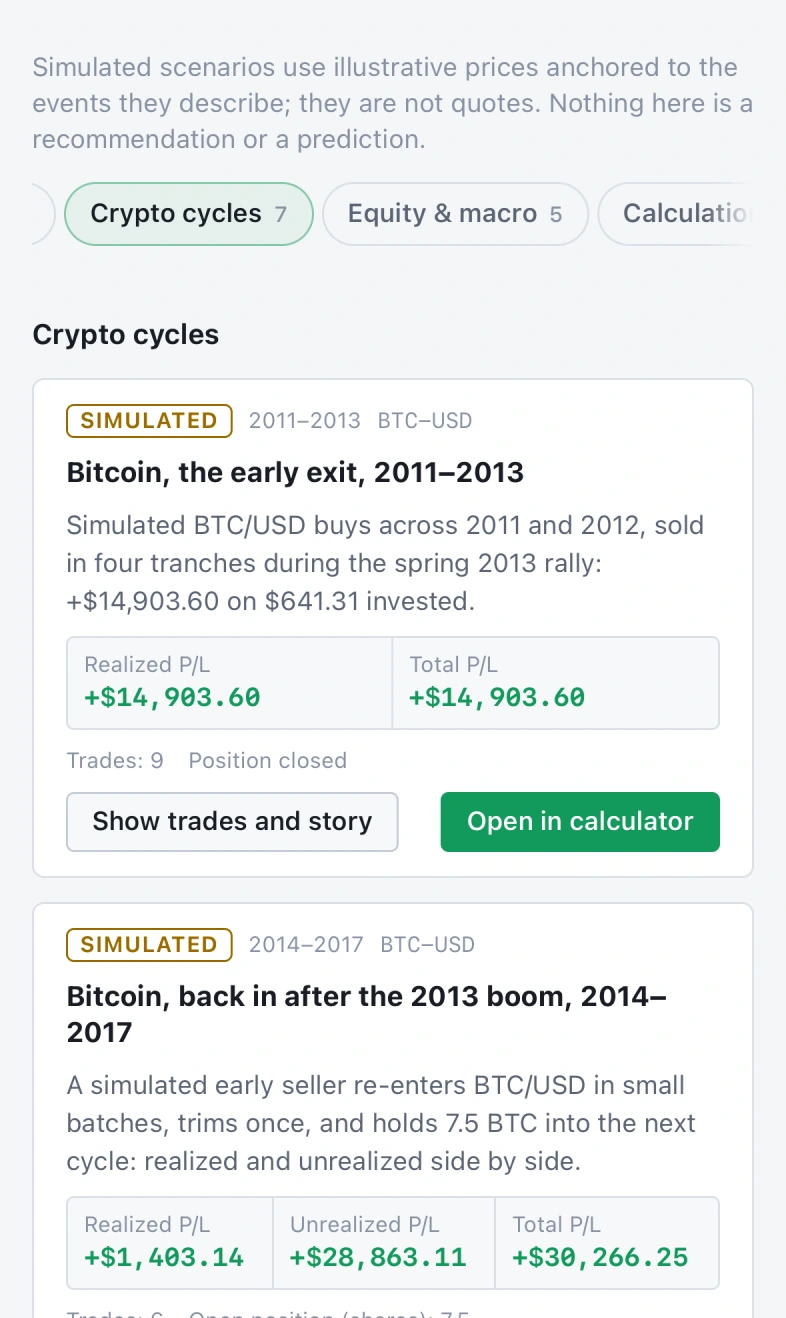
- Compare a simulated early Bitcoin exit with a larger re-entry that ended in a loss.
- See how the 2022 memory downturn could lower your average cost and increase the position’s loss.
- Run the same sale through four cost-basis methods. The realized gain changes with the lots matched to the sale. The total stays at $2,600.00.
The simulations use illustrative prices. To value the shares you still hold, enter your chosen reference price in Share price now. Read the 2.8 release notes.